By: Matt Stockton & Shannon Sand, Agricultural Economists
Background Information
Several University of Nebraska at Lincoln (UNL) specialists grouped together to form a team in the 2023 Subsurface Drip Irrigated (SDI) corn competition of the Testing Ag Performance Solutions (TAPS) program. The following is a short summary of the crop insurance decision made by this team, which is comprised of specialists located at UNL’s West Central Research, Extension & Education Center (WCREEC) and the Panhandle Research, Extension & Education Center (PREEC), both. Members include Matt Stockton (Ag. Economist Extension Specialist in Farm Management, WCREEC), Shannon Sand (Ag. Economist Extension Educator, WCREEC), Randy Lloyd (Agronomist Pesticide Application Lab Research Facility Director, WCREEC), Xin Qiao (Water and Irrigation Management Engineer Specialist, PREEC), and Gary Stone (Water & Integrated Cropping Systems Extension Educator, PREEC). The competition requires each team or farm to maintain a Multi-Peril Crop Insurance (MPCI) policy on their simulated farm acres. Each team has three randomly assigned plots, totaling less than half an acre, each representing one third of the 1,000 acres of their simulated farming operation.
MPCI Background Key Takeaways:
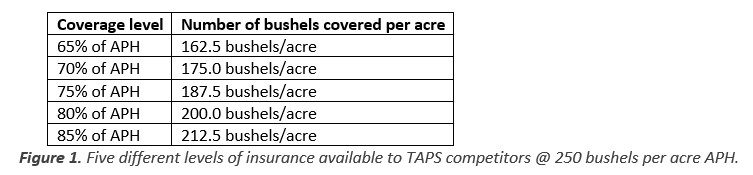
- The Average Production History (APH) for the SDI competition is 250 bushels per acre.
- Normally, APH is set as an average of the last ten years of production.
- In the SDI contest, there are three different types of MPCI available to competitors:
- Yield Protection (YP) insures against yield loss only with indemnities calculated based on projected base price or harvest price, whichever is higher.
- Revenue Protection (RP) insures revenue based on either base or harvest price, whichever is higher.
- Revenue Protection with Harvest Price Exclusion (RP-HPE) insures revenue based on projected base price, but if harvest price is higher, then earned revenue is based on harvest price, which could reduce the indemnity when paid.
- All three types are level set by the insured, as a percentage of APH.
- 2023 projected base price is set at $5.91 per bushel; 2023 harvest price is not yet set.
At the five levels discussed, coverage is offered to competitors in two different types, Optional Units (OU) and Enterprise Units (EU). OU coverage is offered in 333.34 acres segments, meaning each of the three plots represents one third or 333.34 acres of yield and therefore can be insured using optional unit coverage. The EU coverage considers the average of the three plots and thus all are treated as one enterprise or as one 1,000-acre farm.
The Decision & Its Process
As members of the University, our team is interested in the long game, particularly farm profitability with the caveat that the farm is economically viable through time. This fact generates the development of a different insurance strategy, as opposed to a competitor who is looking at the TAPS program strictly as a contest they want to win. In this latter case, the winner-takes-all mentality would tend to prevail, logically leading to viewing insurance as an unnecessary expense, where the players would be willing to market fluctuations and therefore seek a minimum amount of insurance. So, what was our decision, and why would we acquire more insurance than the competition requires? Our team recognized several important facts that helped guide our purchase level and insurance type. Given the unpredictable nature of farming and the high cost of production, the estimated budget cost is expected to be at least $1,105.41 per acre for our 1,000-acre simulated farm. For perspective, this cost is in excess of 1.1 million dollars. We felt it prudent that in the event of a poor market, bad yield event, or some unseen catastrophe, we wanted to at least break even. As suggested previously, our business goal is to maintain a long-term perspective. This means we are looking for steady increases in net worth gained by consistent, reasonable amounts of profit. We also understand the market historically follows a seasonal pattern and were wishful to take advantage of any pre-harvest market opportunities without increasing market and production risk. This requires the use of some of the associated market risk mitigating tools, along with MPCI.
The average 2023 December futures contract price predicted in February, or base price, of corn for MPCI insurance products in the current year is $5.91 per bushel. Dividing the budgeted per acre cost of $1,105.41 by the predicted base value of $5.91 per bushel shows that we would need to sell about 187 bushels per acre to break even. From the list of coverage levels in Figure 1, it is apparent that to accomplish this goal, we would need at least a 75% coverage level, 187.5 bushels per acre, and only considered options, accordingly. To take advantage of pre-harvest high prices, we will be using a diversified strategy to sell corn over the whole season and to use forward, futures, basis, and hedge-to-arrive contracts, as appropriate. We would like to market up to 80% of our APH, 200 bushels per acre, (Figure 1), pre-harvest. Since 80% covers costs more than the 75% option, we decided on the 80% level of coverage. We then decided that, while YP type insurance protects yield, it left us too open to price volatility in the market, which, given world corn price conditions, is not ideal. If we purchase YP insurance and the harvest price falls below the predicted price, no indemnity is triggered. With the revenue protection plans, a reduction in the announced harvest price effectively increases the number of bushels that would be covered.
Take the 80% coverage rate, a YP policy will only pay an indemnity if yields go below the 200 bushels per acre mark. However, RP and RP-HPE, which insure revenue, are a result of both yield and price. To understand our thinking, an example may be helpful. An 80% YP policy in the coming year insures a yield of 200 bushels per acre, which would result in no indemnity payment for yields equal to or above that mark, regardless of any price change. Consider again the same scenario, except that rather than YP, an RP policy is purchased. Let’s say that at the end of the year, the announced harvest price is $5.51 per bushel or $0.40 per bushel less than the base price at which insurance was purchased. Since 200 bushels per acre were produced, that would mean that an indemnity of 200 bushels times $0.40 per bushel should be forthcoming at $80 per acre. Translating this in terms of yield, at a yield less than 214.5 bushels per acre (85.8% of APH), an indemnity of 14.5 times the $5.51 would be triggered, which is equivalent to the effect of a lower harvest price. When harvest price is lower than base price, both types of RP policies result in the same outcome. The two types of RP differ, however, when harvest price exceeds the predicted base price. In the past 22 years, this has happened eight times, (AG360 Insurance, 2023). The average harvest price increase, when it occurred, has averaged approx. $0.84 per bushel. Using this information, if we purchased RP-HPE insurance at 80% and the average harvest price exceeded the predicted base price by the average $0.84 per bushel, this would effectively result in the RP-HPE acting the same as an RP of approx. 70% coverage, and yields would have to be less than approx. 175 bushels per acre to receive an indemnity. Choosing between the two types of RP insurance meant assessing differences in cost and expected associated risk. Without getting too deep into the weeds, the choice came down to determining what we believe is likely to happen to December corn futures for the month of October (harvest price), compared to its average value in February (base price). From our perspective, demand for corn is most likely to decrease from soft imports, declining cattle and hog numbers, and weak soybean prices that will drive some increase in corn acres. With increased volume of product and weaker demand, the average harvest price (October) will likely be lower than the base price (February). For this reason, and the potential size of a price inversion, we chose to use RP-HPE as our policy type.
Looking at the RP and RP-HPE premiums, Figure 2, for both OU and EU units at the 80% level, it is obvious that RP policies for the same coverage level are much more expensive than RP-HPE. As is expected, the more intensive OU coverage type is more costly than EU coverage. Using last year’s TAPS plot data from the sprinkler irrigated corn contest held in North Platte, NE, an 80% coverage level with EU would have paid indemnities to four of the 22 selected farms. With OU coverage, however, three additional farms would have qualified for indemnities for a total of seven farms. OU coverage insures individual plots, and 12 of the 66 plots (belonging to the aforementioned 22 selected farms) were eligible for an indemnity payment. While more farms qualified for an indemnity payment, only one of the seven financially benefited by using OU coverage.
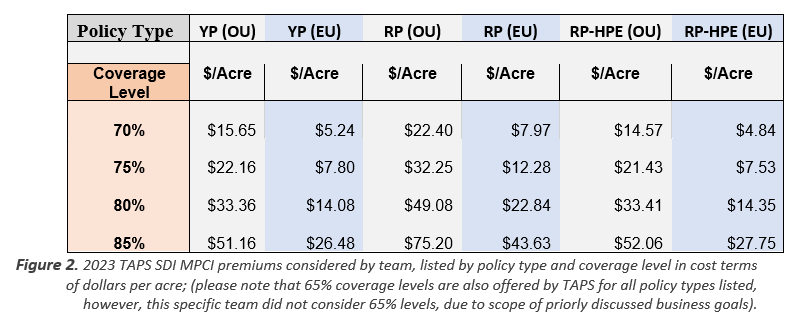
On average, RP-HPE with OU costs about 41% more than RP-HPE with EU units. Our choice was to buy RP-HPE with EU at 80%, so our cost is $14.35 per acre. Assuming the predicted base price will be greater than harvest price, the highest expected cost per bushel produced for this insurance would be nearly $0.072 per bushel. Hopefully, this information and related insight might provide others with ideas about how to calculate the cost and value of purchasing MPCI. Everyone has varying goals and varying needs for insurance coverage. There is no universally correct answer, but there is a best answer for each situation.
Reference:
AG360 Insurance. (2023). Crop insurance pricing. Retrieved April 7, 2023, from https://www.ag360insurance.com/crop-insurance-pricing/.